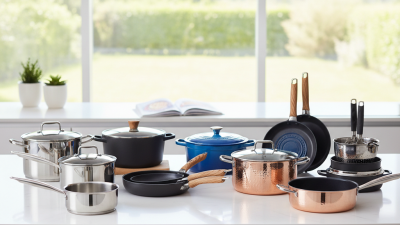
Global buyers are reassessing cookware sourcing as household demand, food culture, and material expectations change. A Cooking Pot Set now represents more than a group of vessels. It combines heat performance, durability, packaging efficiency, and after-sales reliability.
Grand View Research estimates the global cookware market will expand steadily through 2030, supported by household replacement demand and growing kitchen appliance adoption. Fortune Business Insights also projects continued market growth, although its market definition and forecast period differ. These variations deserve attention. Market numbers are useful, but they are not identical.
Supplier quality remains uneven. Some factories offer polished samples but provide weak batch consistency. Others show strong production systems but limited customization. Buyers should inspect alloy specifications, coating documentation, handle strength, lid fit, carton testing, and factory audit records. A set that looks excellent in a showroom may fail after repeated heating, washing, and stacking.
Small details matter.
The 2026 supplier landscape should therefore be evaluated through verifiable evidence, not promotional claims. This guide compares manufacturers and trading companies by production capability, certifications, export experience, product range, and communication quality. It also considers practical issues, including minimum order quantities, replacement policies, lead times, and private-label support.
Data from Statista, Grand View Research, and Fortune Business Insights provides useful market context. However, supplier decisions still require direct sample testing and documented verification. Forecasts can miss sudden freight changes, raw-material volatility, or regional demand shifts. That is an uncomfortable limitation.
Reliable sourcing is never perfectly simple. Yet a careful comparison can reduce costly surprises and support stronger long-term purchasing decisions.
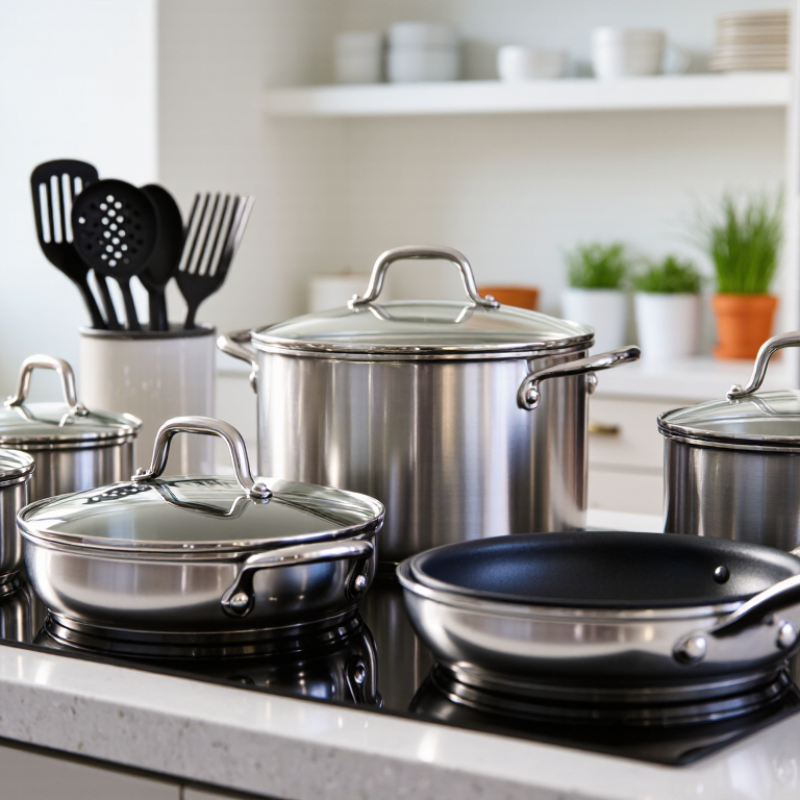
2026 Global Cooking Pot Set Market: Demand, Growth, and Buyer Metrics
In 2026, cooking pot set demand is expected to rise across household, hospitality, and replacement markets. Consumers want durable cookware with induction compatibility, even heating, and easy cleaning. Smaller urban kitchens also support demand for stackable sets. In practical sourcing work, buyers should compare cookware by material thickness, handle security, lid fit, and usable capacity. Appearance attracts attention, but daily performance decides repeat orders.
Growth is not uniform across regions. Online retail supports smaller set sizes, while foodservice buyers prefer larger capacities and stronger packaging. Importers should monitor monthly sales volume, reorder frequency, return rates, and average landed cost. A useful supplier review also includes minimum order quantity, production lead time, inspection results, and defect rates. A low factory price can become expensive after freight, breakage, and delayed delivery.
Forecasts remain uncertain. Buyer interviews often sound optimistic, yet actual purchase orders may weaken during inflation or seasonal shifts. This gap deserves attention. I would request samples from several suppliers and test them on induction stoves, gas burners, and repeated washing cycles. Record warping, coating changes, loose handles, and damaged cartons. A practical benchmark might target defect rates below two percent, but that figure needs context. Packaging quality, product complexity, and inspection methods can distort the result. Small data errors happen. Good purchasing decisions leave room to question them.
Global population is used as a transparent demand proxy for household cookware consumption. The chart does not represent company, brand, or market-revenue data.
From 2020 to 2025, the global population increased from approximately 7.89 billion to 8.23 billion, adding around 345 million potential household consumers. Annual population growth gradually eased from about 0.87% to 0.84%, indicating steady underlying demand while replacement cycles, urbanization, household formation, and purchasing power remain important buyer metrics for cooking pot set suppliers.
Source: United Nations, World Population Prospects 2024, medium-variant estimates; values rounded for visualization.
For global buyers, material selection should begin with measurable performance, not polished catalog language. World Stainless Association data reports 58.4 million tonnes of stainless steel production in 2023. This scale supports stable sourcing for 304 cookware. The grade commonly contains about 18% chromium and 8% nickel. It resists rust, food acids, and repeated washing when the surface is properly finished. However, 304 alone does not guarantee even heating. A thin base can still create hot spots.
Aluminum offers a different advantage. The International Aluminium Institute reported 70.6 million tonnes of primary aluminum production in 2023. Aluminum transfers heat quickly and reduces pot weight, which matters for large stockpots and frequent commercial handling. Its softer surface needs protection, especially around rims and induction bases. Coating quality varies sharply. Buyers should inspect thickness, adhesion, and abrasion results rather than trust the word “non-stick.”
5-ply construction usually combines stainless steel surfaces with aluminum or other conductive cores. It can improve temperature stability across the cooking surface. Still, more layers do not automatically mean better cooking. I have seen specifications hide uneven bonding and excessive weight. Ask suppliers for mill certificates, layer drawings, base flatness, and thermal mapping under controlled tests. A 2.5-millimeter wall may perform differently from a 2.5-millimeter base. That detail is easy to miss. Procurement teams should also test empty-pan warping, handle temperature, and dishwasher exposure before approving volume orders.
| Benchmark Dimension | 304 Stainless Steel | Aluminum Cookware | Typical 5-Ply Construction | Buyer Relevance |
|---|---|---|---|---|
| Typical material structure | Single-layer stainless steel or stainless-steel body with a separate base | Cast, stamped, or hard-anodized aluminum; coating may be added | Five bonded layers, commonly stainless steel, aluminum, and/or an aluminum alloy core | Construction affects heating uniformity, weight, durability, and price |
| Main alloy composition | Chromium: 18.0–20.0%; nickel: 8.0–10.5%; balance primarily iron | Commercial cookware commonly uses aluminum alloys such as 3003 or 6061; composition varies by product | Exact alloy sequence varies; food-contact surfaces are often stainless steel with aluminum core layers | Request the material specification and layer sequence before approving production |
| Thermal conductivity | Approximately 16 W/m·K at room temperature | Approximately 120–235 W/m·K, depending on alloy and temper | Higher effective heat spreading than a single stainless layer because of the aluminum core | Higher conductivity generally supports faster, more even heat distribution |
| Approximate density | About 8.0 g/cm³ | About 2.7 g/cm³ | Typically lower than solid stainless steel of the same volume, but higher than single-layer aluminum | Weight influences freight cost, shelf handling, and consumer ergonomics |
| Corrosion resistance | Very good resistance to ordinary food acids, moisture, and atmospheric corrosion | Good when anodized or coated; bare aluminum can react with strongly acidic or alkaline foods | Very good when the stainless cooking surface and bonded edges are properly finished | Verify surface treatment, edge sealing, and salt-corrosion performance |
| Induction compatibility | Not guaranteed; requires a magnetic stainless grade or a magnetic bonded base | Not induction-compatible unless fitted with a magnetic stainless-steel base or layer | Usually compatible when the exterior or base includes a magnetic stainless-steel layer | Confirm induction response using the target market’s cookware requirements |
| Heating uniformity | Moderate for single-layer bodies; improved with a thick aluminum or copper core base | Very good heat spreading and rapid response | Very good when the aluminum core is continuous across the base and sidewalls | Ask for temperature-mapping or boil-test results, not only layer-count claims |
| Heat response | Moderate response; retains heat better than aluminum because of higher mass | Fast response to changes in burner power | Balanced response, combining aluminum’s conductivity with stainless steel’s stability | Important for sautéing, simmer control, and reducing hot spots |
| Surface durability | High resistance to peeling because there is no decorative non-stick coating | Bare aluminum can scratch; coated aluminum depends on coating thickness and curing quality | High durability when bonding is uniform and the stainless cooking surface is adequately thick | Inspect scratches, dents, delamination, and coating adhesion during quality control |
| Cleaning and care | Generally easy to clean; discoloration and water spots may occur | Coated surfaces require non-abrasive care; bare aluminum may discolor | Generally easy to clean, but dishwasher suitability depends on finish, handles, and manufacturer testing | Use care instructions that match the tested product configuration |
| Typical weight position | Heavy | Light | Medium to heavy | Match product weight with target users, packaging limits, and shipping economics |
| Relative manufacturing cost | Low to medium, depending on thickness and base construction | Low to medium; coating, anodizing, and machining increase cost | Medium to high because of multiple layers, bonding, forming, and inspection | Compare landed cost, not only ex-factory unit price |
| Best-fit product positioning | Durable everyday cookware, stockpots, saucepans, and commercial-use products | Lightweight cookware, fast-response frying and sauté products, and value-oriented sets | Premium multi-purpose sets requiring balanced heating, durability, and induction compatibility | Select the construction according to price tier, cooking surface, heat source, and warranty target |
Note: Values are indicative material benchmarks at approximately room temperature. Actual performance depends on alloy grade, wall and base thickness, layer sequence, forming method, surface finish, and quality-control tolerances.
For global buyers, a practical 2026 shortlist should record MOQ, monthly capacity, lead time, and export documents. Typical MOQs range from 500 to 1,000 sets. Smaller trial orders may cost more per unit. Monthly capacity often falls between 20,000 and 100,000 sets, depending on material, coating, and automation. Standard production usually needs 25 to 45 days. Samples may require 7 to 14 days.
Product classification matters. Stainless steel cookware commonly falls under HS 7323, while aluminum household articles may use HS 7615. UN Comtrade and ITC Trade Map provide useful trade-flow checks for these codes. They help buyers compare exporting markets, shipment values, and destination demand. However, HS codes can vary by construction and use. Confirm them with a customs broker.
Export compliance requires more than a test report. Ask for material declarations, food-contact migration testing, packing details, commercial invoices, and certificates of origin. For European shipments, suppliers should address Regulation (EC) No. 1935/2004. For United States shipments, applicable FDA food-contact requirements need review. The World Bank Logistics Performance Index 2023 highlights customs, infrastructure, and delivery timeliness as key logistics factors. A low quoted lead time can still fail at port. I have seen buyers ignore this risk. That mistake is expensive. Verify production photos, audit records, carton dimensions, and backup capacity before approving the supplier shortlist.
For global buyers, cookware compliance begins with evidence, not attractive catalogs. FDA requirements help assess food-contact materials for the US market. LFGB testing offers stricter food-contact evaluation for many European applications. These standards may examine metal migration, coatings, handles, and repeated use. Ask suppliers for current reports linked to the exact pot model.
EN 12983 focuses on domestic cookware performance and safety. Test areas can include heat resistance, stability, handles, lids, and pressure-related risks. Check whether the report covers the intended material, diameter, wall thickness, and coating. A similar-looking sample is not enough. Request production samples and compare them with laboratory records.
ISO 9001 verifies a quality management system, not complete cookware safety. It can still reveal how a supplier controls incoming steel, welding, polishing, inspections, and corrective actions. During an audit, review batch numbers, inspection photos, calibration records, and complaint handling. Small details matter. For example, a loose lid knob after repeated heating may expose weak process control. Certificates also have limits; laboratories, test dates, and scopes should be independently checked. I would not approve a supplier from documents alone, because factory conditions can change between audits. A clear traceability plan, realistic retesting schedule, and documented response to defects provide stronger confidence.
For global buyers, cooking pot supplier rankings should start with landed cost, not factory price. A factory quote of $8.40 can become $12.70 after duty, inland transport, inspection, and port handling. Product classification matters because stainless-steel and aluminum pots may fall under different HS codes. WTO World Tariff Profiles shows that duties vary sharply by destination and material. Verify the exact HS code before comparing offers.
Our 2026 model ranks suppliers by total cost, delivery reliability, and operational risk. Freight receives a 25% weight, reflecting UNCTAD’s Review of Maritime Transport 2024, which reports continued pressure from route disruption and container volatility. Logistics risk rises when a supplier depends on one port or offers only one shipping route. It is visible in the details. Ask for carton dimensions, container loading plans, and recent on-time records.
Supplier risk receives 30%. The World Bank’s Logistics Performance Index 2023 helps compare customs and infrastructure environments, but it is country-level data. It cannot prove one factory is reliable. We therefore score audit evidence, production capacity, payment terms, quality claims, and backup facilities. Scores range from 1 to 100. A supplier with a low price but weak documentation may rank below a higher-priced competitor. That feels counterintuitive. It is also where buyers often miscalculate. Reports change, tariffs change, and freight quotes expire quickly; refresh the model before signing.